When we analyze data, one of the main rules that we learned is that we should not interpret the main effects when their interaction is statistically significant.
Actually this rule is, in some cases, an inconvenient simplification. In my opinion the opposite is true: when a significant interaction emerges from the analysis of the data, it is absolutely necessary to describe and give an interpretation of what the main effects tell us.
Let’s discover two examples. In the first example the rule appears to be correct. In the second one, no.
Example #1: main effects that cannot be interpreted
We analyze the value of an average blood pressure in respect to age in two groups: subjects that follow a high-calorie diet and subjects that follow normal diet style. Your endpoint is a blood pressure. Two main effects are age and type of diet (normal or high calorie).
You will get a trend like this:
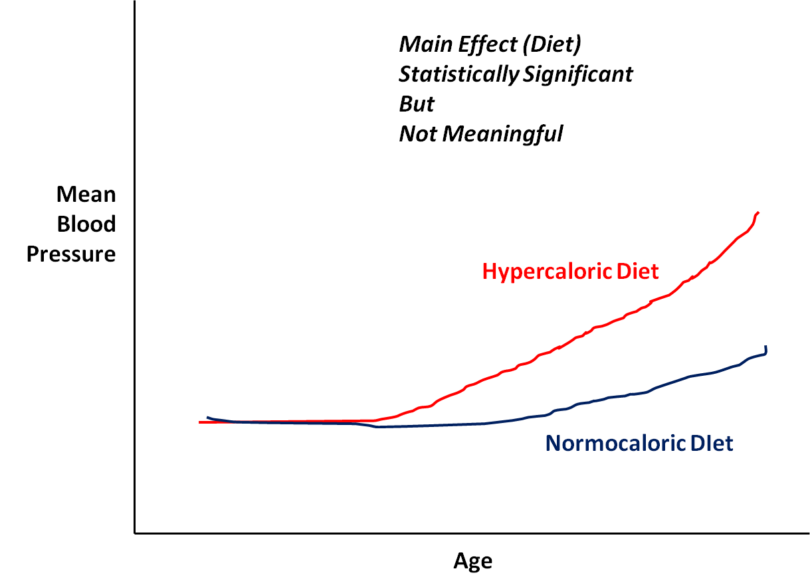
Let’s say you get both the main effects and the interaction significant. Does it make sense in this case to interpret the main effects? No.
The arterial pressure will rise only for one of two categories (high-calorie diet), while for people who follow a normal calorie diet style, it will remain stable for entire life (or will increase slightly).
In this case the main effect “age” may be significant because your test will consider the average effect of time on both groups, and the contribution in this case of the “high calorie diet” group makes the test significant. For this reason, the main effect “age” cannot be interpreted. Age affects the value of pressure in one of two groups and not in both of them.
The same is true for the effect of a type of diet: it may be significant but only after a certain age (in fact, until about forty years, two groups have equal blood pressure, thanks to the compensation mechanisms of the youth). The type of diet, that is, determines a blood pressure but only after a certain age.
In this case only the interaction can be interpreted, namely, the value of one of the main effects must be interpreted in light of the value of the other main effect. Stop here.
Example #2: the main effects that can be interpreted
The example below is different in respect to the first one. In this experiment we have 2 groups: a group of individuals with familial hypercholesterolemia and a group of individuals without the disease. The study endpoint is a cholesterolemia monitored for the course of a lifetime.
The results we obtain are the same as in the first example: both main effects (age and hypercholesterolemia / healthy group) and their interaction are significant.
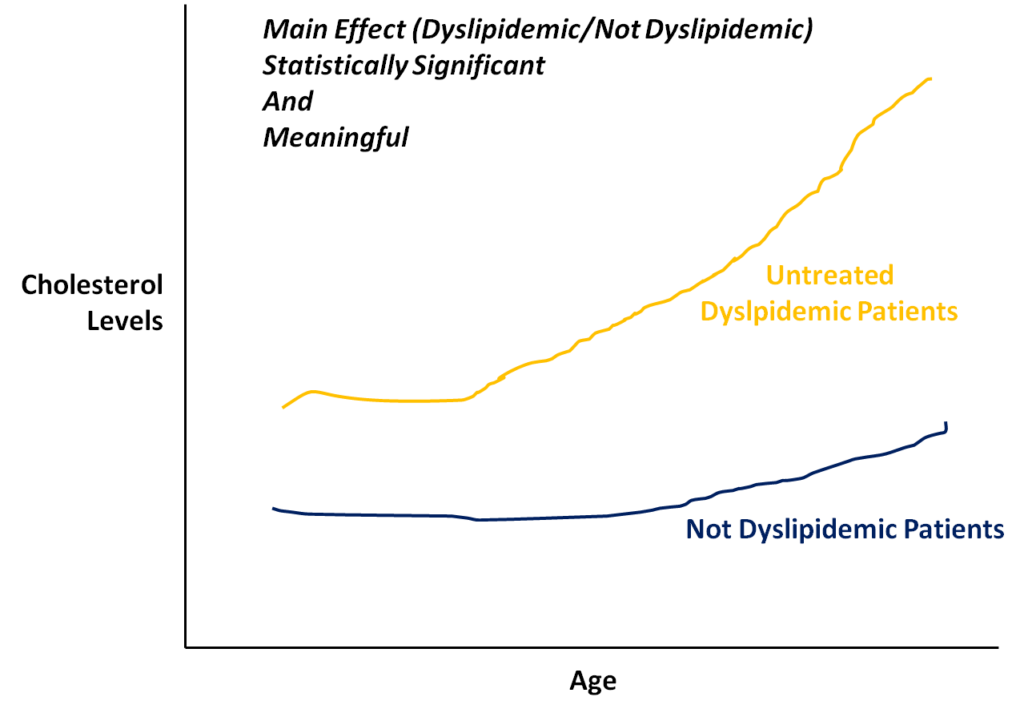
However, this graph clearly tells us that the main effect of the presence / absence of the disease is present throughout the study, regardless of age.
Starting from the birth date, the fact of being affected or not by familial hypercholesterolemia determines the value of cholesterol in the blood significantly. Then, the effect of the interaction between the presence of the disease and age can increase this difference (especially if the disease is not treated).
This is a scenario in which the main effect gives us a very precise information that must be interpreted and communicated when we publish the results of the study.
To summarize, what should remain in the mind of the researcher who interprets the data, is the meaning of the data. Relying on “pre-established rules” can be convenient and sometimes very useful, but this does not mean that we can’t observe and interpret the clinical reality that the data provide us with.
THANKS FOR YOUR ATTENTION!
Do you need Help? Contact us
[contact-form-7 id=”140″ title=”Modulo di contatto 1″]
I conducted the MANOVA for Physical Activity level (low, moderate and vigorous) and Physical Activity category (Athletic and Non-athletic) along with gender (M and F). I found significant effects by physical activity levels, physical activity category and also by gender. Then I interpreted with the help of t-test (for athletic and non-athletic and for males and females) and contrast k matrix (for low, moderate and vigorous) to examine the significant differences in DVs. I also found an interaction effect by physical activity level nad physical activity category. I know how to report this. To study the significant differences in DVs due to interaction I used estimated marginal means. There I am getting mean, sts error and sig. Values for DVs. I am unsure about reporting sig. Differences due to this interaction effect. Like how can I write VO2 max was higher in low/mod/vig physical activity group from athletic population etc.
Hello,
thank you for the content you post, it is helping me a lot in the wirting of my master’s degree thesis!
In the firsts example you show how the two variables start from the same point and therefore it is not worthy to interpret main effects.
This left me with a doubt, in the case of having a three level categorical variable (representing different levels of social isolation) for which one of the levels does not start from the same point as the others, it is then worthy to interpret the main effects?
I am asking because i am having this big doubt of reporting firstly the models with the main effects and secondly the models with the interaction. In my case my sample is from 92 days, from which 72 were part of the quarantine time, and I believe that just because of that I shouldn’t have to interpret models that don’t consider the interaction. What do you think?
Thanks in advance!
Thanks!